Sun 20 Dec 2009
2009 Green Street Traffic Analysis
Posted by Christian Donner under Traffic and SafetyComments Off on 2009 Green Street Traffic Analysis
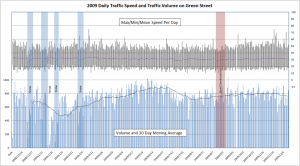
The analysis chart for 2009 shows 2 sets of data over time. The top graph represents the maximum, minimum, and the mean speed per day. The bottom graph shows the number of cars counted per day, plus a 30-day moving average to highlight trends.
The deep snow cover in February blocked the radar device’s the clear view to the street, which caused much lower numbers for several weeks. Only larger cars and trucks would register.
With only one year’s worth of data, there is not too much that can be interpreted into this chart. Aside from isolated events such as snow storms, road construction, holidays etc. that have an impact on traffic patterns, the seasonal variations in traffic make a long-term prognosis impossible. It is interesting to see how little an impact the chip-and-tar application had last August on both traffic volume and speed patterns, though. Or that back-to-school day is busiest day of the year, traffic-wise, with a clear margin.
It appears that both overall volume and speeding offenses are on the increase, but in order to extract a trend, at least 5 years of data will be needed. Once the homes on Eric Road are occupied, there will certainly be an impact on the traffic volume on Green Street that should be apparent on next year’s data. Once there are multiple years of data, I will publish a year-to-year comparison by month, to eliminate seasonal variations.
